

WASHINGTON, May 25, 2026, 16:11 (EDT)
- NASA’s Black Marble maps are showing a raw brightening signal that works out to 34% above the 2014 baseline; however, dimming in some areas pulled that headline gain down.
- China, India, Africa, and Southeast Asia saw gains. Europe faded, as did parts of the U.S. and areas affected by conflict.
- Scientists point to uses like tracking power access, war damage, policy changes, and light pollution. Still, the satellite record isn’t without its limits.
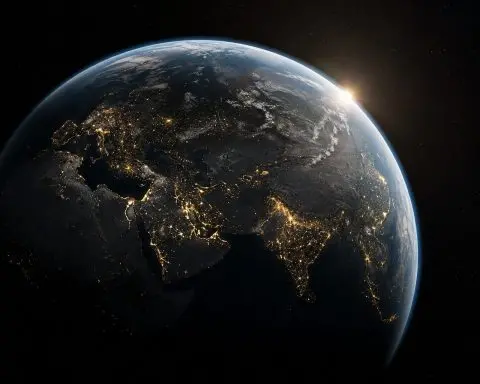
NASA’s newest Black Marble data points to a brighter Earth at night between 2014 and 2022, but the headline isn’t just more lights. It’s uneven. Some places are lighting up; others, losing their nighttime glow—sometimes on purpose, other times not so much.
It’s relevant now: night lights offer a direct, if imperfect, view of human activity—from cities pushing outwards and power grids collapsing, to gas flares lighting up oil fields or blackouts in war zones and places where authorities have dimmed the lights on purpose. NASA’s Black Marble data isn’t just about mapping city glow; it’s also key for tracking light pollution, spotting illegal fishing, flagging gas flaring, even monitoring conflict zones.
Sunday’s reporting on the maps took a different angle, noting that in some regions, light pollution can actually be rolled back. EarthSky, referencing NASA’s May 15 release, singled out northwestern Europe—several countries there have seen their night skies grow darker.
The study, out in Nature on April 8, reports brightening contributed radiance equivalent to 34% of the 2014 baseline. Dimming, on the other hand, cut 18%, so net artificial light at night climbed 16%. Radiance here refers to light output as detected by the satellite sensor.
Researchers pored over 1.16 million daily NASA Black Marble nighttime-light images, tracking 15.16 million square kilometers—roughly a tenth of Earth’s land. They left out areas that stay dark or get only brief natural flares. Artificial light at night, or ALAN, refers to any human-made illumination seen after sunset.
NASA’s Black Marble project taps the VIIRS sensors—short for Visible Infrared Imaging Radiometer Suite—mounted on the Suomi NPP, NOAA-20 and NOAA-21 satellites. These instruments pick up faint glimmers of light at night, enabling the agency to assemble records on a daily, monthly and yearly cadence, sidestepping the old reliance on slower composite imagery.
Across Asia, light picked up almost everywhere—urban buildout, new factories, and a wave of rural electrification in China and India, as well as stretches of Sub-Saharan Africa, all played a part. Europe went the opposite direction. Nighttime radiance slipped by 4% overall, the study shows, with France posting a steep 33% drop, the UK down 22%, and the Netherlands off by 21%.
The U.S. picture was divided. Cities out west got brighter, but lights faded across the East Coast and swaths of the Midwest. Researchers tied this patchwork to shifting populations, changes in the economy, and the spread of energy-saving lighting. Oil and gas country in the central states was jumpy—flares and drilling booms made the lights swing wildly.
Earth’s nighttime lights are in flux, “highly volatile,” according to Zhe Zhu, a University of Connecticut professor who led the study. Zhu points to a “massive expansion of energy access” behind much of the brightening. On the flip side, satellite data tracked major drops in nighttime brightness over Lebanon, Ukraine, Yemen, and Afghanistan, Reuters noted. Haiti and Venezuela also faded as economic turmoil and patchy electricity took their toll. Reuters
Zhu called the daily record a “heartbeat of society,” able to reveal how shocks ripple through the real world. Tian Li, lead author on the study, added that the team relied on repeated, back-to-back observations to be sure the shifts they saw weren’t “just noise.” UConn Today
Cadence sets these newer night-light products apart from their predecessors. According to the Nature paper, annual and monthly satellite composites—built from earlier DMSP-OLS and VIIRS data—have been useful for charting broad trends through the years. But they miss a lot: lockdowns, sudden policy shifts, blackouts, conflict wreckage. Daily data picks those up.
But these maps fall short of showing exactly what people or wildlife deal with at ground level. VIIRS picks up mostly upward light, and only after midnight—its overpass hits around 1:30 a.m.—so it misses much of the evening lighting. The sensor’s strongest response is in the 500 to 900 nanometer range, which means it can’t see some LED colors or light that happens earlier in the night.
So, if satellites show a dip in brightness, it could signal improved lighting standards, tighter energy supplies, or even grid failures. The images alone won’t say which is at play. What’s clear: nighttime shots from orbit now chart expansion, caution, and sudden shocks — not simply a world getting more lit up.